A weighted overlay service references an image service that is based on a mosaic dataset. The weighted overlay service allows you to overlay the raster layers within that mosaic to identify areas based on your criteria. The mosaic dataset must contain specific fields, information, and properties to enable overlay based on location and criteria.
See Prepare your data for information on how to create and configure your raster datasets for inclusion in a weighted overlay service. Make sure you follow the instructions in that document before you continue with the workflow outlined below.
Once you have prepared your data and generated a set of geoTIFF rasters, create some additional information about those rasters before adding them to a new mosaic dataset. The additional information is used to describe raster layers within a weighted overlay service. This includes a raster layer title, input value ranges, mapping to an output suitability scale, and range labels for display within the weighted overlay service. Each raster layer added to a weighted overlay service must have this additional information.
This document describes how to create that additional information using the Configure Raster Fields tool. It also details how to create a new mosaic and add your raster layers to it using the Build Mosaic Dataset tool. This tool adds raster layers to a new mosaic dataset, populates fields specific to a weighted overlay service with information created by the Configure Raster Fields tool, and sets a key property value in the mosaic.
Both Configure Raster Fields and Build Mosaic Dataset are part of the Weighted Raster Overlay Service toolbox.
Define raster layer field data using the Configure Raster Fields tool
Each raster layer within the weighted overlay service's mosaic dataset must present certain information. This information enables the service to display the criteria inherent in each raster layer for overlay and analysis. Weighted overlay requires that input data ranges be mapped to an output common suitability scale. This allows multiple cells from different raster layers to be weighted and summed into a suitability score. Furthermore, to help interpret the values in this suitability score, add range labels to each raster layer in the weighted overlay service's mosaic dataset. For example, suppose you have a raster with values from 0 to 100 and the following classifications:
- 0—No Data
- 1–20—Very poor
- 21–40—Poor
- 41–60—Average
- 61–80—Good
- 81–100—Excellent
Based on these values, use the Configure Raster Fields tool to create raster layer information as follows:
| Field name | Value |
|---|---|
| InputRanges | 1,21,21,41,41,61,61,81,81,101 |
| OutputValues | 1,3,5,7,9 |
| NoDataRanges | 0,1 |
| RangeLabels | Very Poor,Poor,Average,Good,Excellent |
| NoDataRangeLabels | No Data |
Note:
In the InputRanges field, The bottom end of each range is inclusive and the top end is exclusive. For example, range 1–20 would be specified as 1,21. Values in the InputRanges and OutputValues fields should be integers and comma–delimited. Also, there should not be any spaces between values in the comma-delimited lists.
You must execute the Configure Raster Fields tool for each raster layer included in your weighted overlay service. The following steps detail how to use the Configure Raster Fields tool to add raster layer information for use in a weighted overlay service. Each parameter should be considered required unless indicated as optional within the steps below.
- Add your raster layers to ArcMap and save a new map document (*.mxd).
- Double–click the Configure Raster Fields tool in the Weighted Raster Overlay Service toolbox toolbox.
- In the Input Raster drop-down list, choose a raster dataset.
- In the Title text box, type a title to display for this raster layer in the weighted overlay service.
- Optionally, in the Description text box, type a description for this raster layer. The description displays as an information popup in the weighted overlay service when the service is accessed from GeoPlanner.
- Optionally, in the Metadata text box, type metadata information that describes this raster layer in the weighted overlay service.
- Optionally, in the URL text box, type the URL to a hosted image layer. The layer displays as a preview button in the weighted overlay service when the service is accessed from GeoPlanner. Use this field to provide preview functionality for the raster layers in your weighted overlay service's mosaic dataset. You must share each raster layer that you want to preview as an image service.
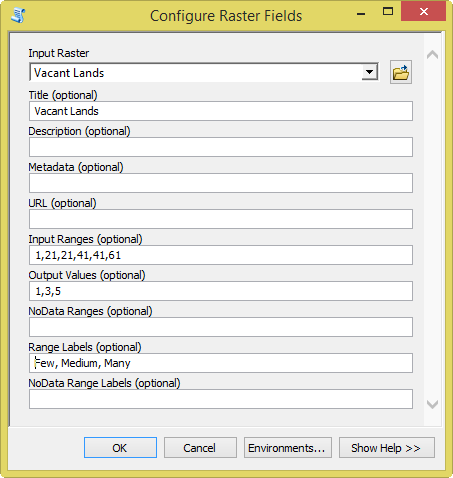
- In the Input Ranges text box, type a comma-separated list of input range bounds from your Input Raster. Values within this list of range bounds are formatted as min-value,max-value,min-value,max-value. For example, for a raster with values of 1-60, an input range could be 1,21,21,41,41,61. This would describe three ranges—1-20, 21-40, and 41-60. Values within the input range are minimum–inclusive and maximum–exclusive.
- In the Output Values text box, type a comma-separated list of output values. Values within this list represent a suitability scale. Values in the Input Ranges text box are mapped to these values. For example, the values in the Input Ranges text box from step 8, 1,21,21,41,41,61, could be mapped to a suitability scale of 1,3,5. This signifies that values in the range of 1-20 map to the suitability scale value of 1. Values in the range of 21-40 map to the suitability scale value of 3. Values in the range of 41-60 map to the suitability scale value of 5. The number of output values should be exactly half the number of input value ranges.
- Optionally, in the NoData Ranges text box, type a comma-separated list of No Data values. This list identifies values within a raster layer that are considered as no data values within the weighted overlay service. Values within the range are minimum–inclusive and maximum–exclusive.
- In the Range Labels text box, type a comma-separated list of labels that display with your input ranges. For example, setting range labels of Few, Medium, Many with Input Ranges from step 8, 1,21,21,41,41,61 display Few for range 1-20, Medium for range 21-40, and Many for range 41-60. Your tool should resemble the following screen capture.

- Optionally, in the NoData Range Labels text box, type a comma-separated list of labels to display with your NoData Ranges.
- Click OK.
The Configure Raster Fields tool creates an auxiliary file that contains the information you specified. This file is used by the Build Mosaic Dataset tool to populate fields within the mosaic.
Create a mosaic dataset and add raster layer field information
In the previous section, you generated field information for each raster layer that you will add to a mosaic dataset. As mentioned above, a weighted overlay service references an image service that is based on a mosaic dataset. The raster layers and the criteria generated by the Configure Raster Fields tool represent the criteria that will be available for modeling within a weighted overlay service. In the following section, you use the Build Mosaic Dataset tool to create a new mosaic dataset, add raster layers to it, then populate fields with the information you created in the previous steps.
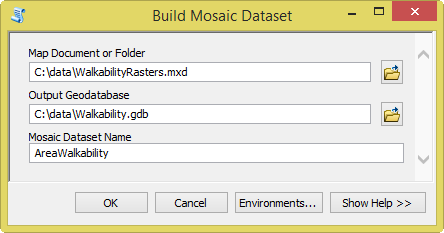
- Double–click the Build Mosaic Dataset tool in the Weighted Raster Overlay Service toolbox toolbox.
- In the Map Document or Folder text box, navigate to the location of the map document that you saved in step 1 in the Define raster layer field data using the Configure Raster Fields tool section above.
- In the Output Geodatabase text box, navigate to a file geodatabase that will store your mosaic dataset.
- In the Mosaic Dataset Name text box, type a name for your new mosaic dataset. Your tool should resemble the following screen capture:

- Click OK.
Build Mosaic Dataset creates a new mosaic dataset in the geodatabase you specified in step 3.
In this workflow, you have learned how to generate raster field information used for display in your weighted overlay service. In the following workflow, Publish your data as a weighted overlay service, you'll learn how to share the mosaic dataset you just created as an image service and an item in your organization. Once shared as an item, others can access the service for suitability analysis.