Weighted overlay is a type of suitability analysis that helps you analyze site conditions based on multiple criteria. Weighted overlay analysis allows you to combine, weight and rank several different types of information and visualize it so you can evaluate multiple factors at once. By identifying and rating areas based on criteria, you can discover opportunities, risks, and constraints in an area. Weighted overlay analysis produces suitability models. Suitability models help answer questions like "Where are the greatest risks for insect damage?" or "Where are optimal locations for a commercial development?" The answers to these types of questions depend on your input data and the criteria you define from that data.
Weighted overlay with GeoPlanner leverages a special type of image layer known as a weighted overlay service. These services are published to your portal's federated ArcGIS Server and become items in your organization. There are also weighted overlay services provided by Esri and available publicly in ArcGIS Online. These include ecological and physiographic datasets that have global extents. Some services are maintained and updated by Esri so your analyses always execute against current data. The suitability models created by the GeoPlanner weighted overlay widget are image layers referenced as items in your organization. These are referred to as weighted overlay model services, or models for short.
You can add these services curated by Esri as items to your portal if you have access to ArcGIS Online.
Understanding weighted overlay
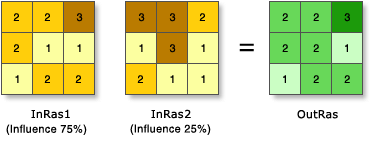
Weighted overlay has three conceptual steps. First, each raster layer is assigned a weight, as a percentage, in the analysis. This allows you to emphasize the relative importance of each layer in the analysis. Second, values within each raster layer are mapped to a common suitability scale. This allows you to compare the different types of information in each raster layer. Third, all raster layers in the analysis are overlaid. Each raster cell’s suitability value is multiplied by its layer weight and totaled with the values of other raster cells it overlays. The result is a suitability value that is used for symbology in the output raster layer.

Add Esri–curated services to your portal
Currently, Esri curates two publically available weighted overlay services. You can add these services as items to your portal if your portal can access ArcGIS Online and if you have an ArcGIS Online organization. The following steps detail how to add weighted overlay services curated by Esri as items to your portal.
- Log in to your portal with an account that has privileges to create content.
- Open the My Content page, click Add Item, and choose From the web.
- In the URL field, type https://utility.arcgis.com/usrsvcs/servers/24b7c7752170431a95719323a9e71a5e/rest/services/WRO_World_Ecophysiographic_Data/ImageServer. The Title field will auto–populate with WRO_World_Ecophysiographic_Data.
- In the Tags field, type weightedOverlayService.
- Click Add Item.
- In the item's page, click Share.
- In the Share dialog box, check a group, groups, or portal organization to share the item. Click OK.
- Repeat steps 2 through 7 and use http://landscape3.arcgis.com/arcgis/rest/services/Landscape_Modeler/USA_Weighted_Overlay/ImageServer for the URL.
Note:
This service is a secure URL. You must enter valid ArcGIS Online credentials to add it as an item to your portal and use it for analysis in GeoPlanner.
Weighted overlay in GeoPlanner
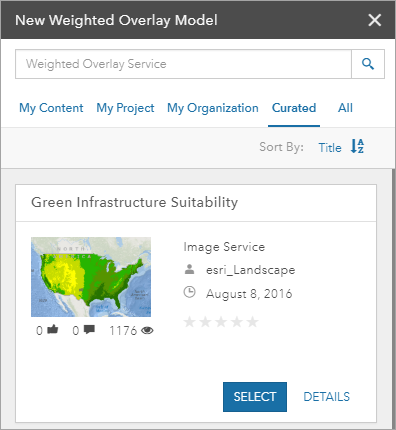
The weighted overlay services you added to your portal in the previous steps can be accessed through the GeoPlanner's Modeler tool in the Explore segment. Clicking the Modeler tool displays a drop-down list. You can choose to create a new model or load an existing weighted overlay model from the contents pane into the Modeler widget. If you choose to create a new model, a weighted overlay service browser appears. This browser contains a list of all weighted overlay services available to you in your portal or, if you have access to it, ArcGIS Online. These services contain layers that you use to perform weighted overlay analysis.

- On the application toolbar, click Explore and then click Modeler.
- In the Save Model dialog box, type a name for your model. Click Save.
The Save Model dialog box closes. The model is processed in ArcGIS Online and is returned as an image layer to the application.
Weighted overlay models provide a powerful way to visualize and analyze site suitability factors. Based on the shading in your model, you can identify areas of opportunity and risk, and you can use this information for real–time feed back in GeoPlanner dashboard charts. These charts show how your design or other feature layers overlay with assessment layers. This view can help you understand the suitability or risk in your designs and plans.