GIS basemaps provide a visualization framework on top of which you can add your operational GIS layers in web GIS applications. In some cases, you will need to build and serve your own basemaps for a particular area of interest or specific information theme. Some examples include parcels, engineering, facilities management, hydrology, utilities, geology, population and demographics, planning, and so on.
Often, in these situations, you are typically already compiling fundamental, authoritative base information for one or more web GIS applications. This approach leverages content that your organization builds and maintains. In addition, this focuses support on your users by providing a framework or basemap that is fundamental to their daily operations.
Design considerations for basemaps
The following is a useful checklist that can guide you in designing and creating effective basemaps for use in web GIS applications.
Design for the target web GIS application
The choice of map symbols and display properties will be quite different for a map that is intended for display on a computer screen and one that is intended for printing on paper, and there are almost as many differences between some of the applications that you will provide to your end users.
It's important to design your basemaps for a set of targeted web GIS applications. For example, some basemaps are designed to work on mobile devices with small screen displays and resolutions. Additionally, mobile maps need to work well in the natural light conditions found in the field. Some basemaps are traditional 2D maps intended for use in a web browser, while others are 3D maps intended to work in a 3D web GIS application.
Design your basemap for adding and working with operational layers
Effective basemaps require some graphical structuring. The GIS basemap you are creating provides a background on which operational information and results will be displayed, visualized, and used.
Unlike printed basemaps, your digital basemap requires information be presented using more subtle colors, fewer text labels, and less bold symbols. You will reserve the use of these cartographic elements for your operational layers that you layer on top of your basemap. Ensure that your basemap provides a strong geographic context and framework in which your operational information is to be visualized and used.
Design multiresolution basemaps
A common goal for basemap design is to create a basemap that can be displayed at multiple scales. This requires a design that considers how the map is to be portrayed at each scale.
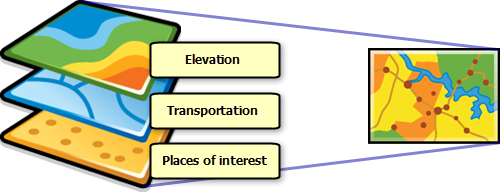
ArcGIS Desktop and ArcGIS Pro can use scale-dependent drawing to accomplish this. Consequently, how you organize the scale dependencies in your map document is counterintuitive to what you might expect. GIS users typically organize their maps as an ordered list of theme-based layers. For example, a set of map layers are created, one for each theme such as is shown below:

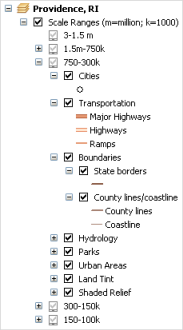
Contrast this with the pattern used to build a multiscale basemap. In this case, you will design and create one group layer for each map scale that is to be included in your basemap. Each of these group layers contains all the thematic map layers (along with their drawing, symbol, and label properties) for displaying the map at that map scale. Here is an example table of contents in ArcMap for a multiscale map design:

Here's a way to think about and define your multiscale map design. Suppose that you want to generate a multiscale map that displays at four map scales:
| Maps scale used for design and map creation | Visible scale range settings in ArcGIS Desktop |
|---|---|
1:100,000 | 1:75,000 to 1:250,000 |
1:50,000 | 1:40,000 to 1:75,000 |
1:25,000 | 1:15,000 to 1:40,000 |
1:12,000 | 1:5,000 to 1:15,000 |
First, you would make a copy of each layer in the table of contents for each of these map scales and apply symbology to each. Then, you organize the collection of map layers into a group layer for that map scale.
Incorporate overview maps for display at the smallest map scales (the most zoomed-out scales) in your basemap
In many cases, you will require an overview map of your entire area of interest that is drawn at a smaller map scale than the map scales at which your users will perform the majority of their work tasks. For example, you will probably want an overview map for your entire study area, or you may need a statewide overview map for your work. In both cases, most of the work is performed within more tightly focused geographic areas (for example, zoomed into a county and larger map scales).
In these cases, you can leverage an existing basemap service for your study area-wide views (like those from ArcGIS Online). You can extend such basemaps with a display. For example, put your study area polygon on top with a few points of interest and map labels. Alternatively, you can create your own overview maps for these small-scale displays. The main point is to keep your overview map scales clear and focus your energy and creativity on the more detailed map scales of your multiresolution basemap.
Use cached map services in place of dynamic map services
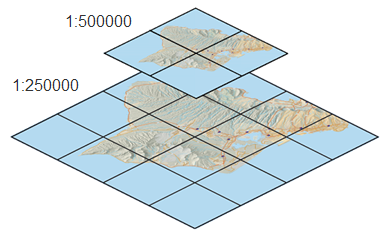
One of the key tenets for improving performance in any web GIS application is to precompute, or cache, basemap elements. ArcGIS can precompute your basemaps as cached map services, which are stored as a series of map image tiles on disk for a range of map scales and levels of detail. Here is a schematic of how a map cache is structured for two levels of detail:

When users access a map cache through a client application, the tiles are returned for the appropriate level of detail instead of the server computing the map view each time. This significantly increases performance and scalability. Caching is the primary mechanism used by ArcGIS Online, Bing Maps, and Google Maps to achieve high performance. You can get this same effect using cached map services in your basemap. For more information on building map caches, see the topic What is map caching.